AI on Watch - Insights from the DNV-BRAIN Hackathon 2025
Summary
In March 2025, DNV partnered with BRAIN NTNU to host a 24-hour hackathon focused on advancing situational awareness (SitAw) systems for autonomous ships. As AI becomes increasingly embedded in complex systems, such as autonomous vessels, ensuring their safety and reliability is a growing challenge. DNV, a global leader in assurance and risk management, is committed to developing rigorous testing methodologies for AI-enabled systems. This hackathon was part of that mission — designed to explore innovative approaches to object detection in maritime environments, and to foster collaboration with the next generation of AI talents.
The hackathon challenged NTNU students to build machine learning models capable of detecting and classifying maritime objects from real-world camera data collected on board the Hurtigruten vessel. The dataset included 464 annotated images under varying conditions, with object classes ranging from sailboats and fishing vessels to rescue and supply ships. Participants were provided with a baseline YOLO model and asked to improve upon it, focusing not only on accuracy but also on model speed, explainability, and uncertainty estimation.
Submissions were evaluated using a combination of metrics: 50% for model performance (with mAP@50 as the primary metric), 25% for the quality of the written report, and 25% for the final presentation. Additional metrics like precision, recall, and mAP@50-95 were also considered to provide a more holistic assessment. Creativity and sustainability were recognized with special awards, encouraging participants to think beyond raw performance.
Nine student teams participated, showcasing a wide range of innovative strategies — from advanced data augmentation and hyperparameter tuning to smart sampling and explainability techniques like GRAD-CAM. The winning team, Epoch No 20 Freeze 6, stood out for their use of the SAHI framework to improve detection of small objects and a custom sampling strategy to address class imbalance. Other teams who stood out included the Data Driven Dreamers, who won the creativity and best presentation prizes, Gruppe 3, who earned the sustainability award for achieving strong results with minimal computational resources, and Crash Course, who won the funniest presentation prize.
Curious to see how students tackled real-world AI challenges in maritime autonomy? Read on to explore the full story behind the DNV-BRAIN Hackathon 2025 — from the motivation and technical setup to the creative solutions and lessons learned. Whether you are an AI enthusiast, a maritime professional, or someone interested in organizing hackathons, this deep dive offers valuable insights and inspiration!
Table of Contents
- Summary
- Introduction: Why did we host a hackathon?
- Task given to the participants
- Description of the dataset
- Evaluating submissions
- Hackathon organization
- Winners and implementations
- First prize winner: “Epoch No 20 Freeze 6”
- Creativity prize winner: “Data Driven Dreamers”
- Sustainability prize winner: “Gruppe 3”
- Special prize for best presentation: “Data Driven Dreamers”
- Special prize for funniest presentation: "Crash Course"
- Lessons learned
- Conclusion
Introduction: Why did we host a hackathon?
In today's rapidly evolving technological landscape, complex systems are increasingly becoming a blend of sophisticated hardware and software components, especially with the integration of AI capabilities. These systems, such as autonomous cars and autonomous ships, promise new functionalities and efficiencies, but also pose significant challenges in terms of verification and validation. At DNV, we are dedicated to pioneering methods to rigorously test AI-enabled complex systems to ensure their reliability and safety.
To effectively test complex and autonomous systems, hands-on knowledge and experience are crucial. Over the years, we have been collaborating with industry partners to test autonomous navigation systems (ANS) for ships. Like many autonomous systems, an ANS typically follows the sense-plan-act paradigm: it senses the environment, plans its actions based on the interpreted data, and acts through control mechanisms to execute decisions.

Figure 1: Sense-plan-act paradigm from robotics.
Figure 1 shows the Sense-Plan-Act paradigm, as commonly used in the field of robotics to explain different subsystems needed to create autonomous robots or systems. This can also be called the Sense-Think-Act cycle. To autonomously operate in the real world, like humans do, it is necessary to have systems that can sense the environment, then process and evaluate the sensory observations to create situational awareness (SitAw) to reason and plan on, and subsequently be able to act in the environment, executing the plan. Sensory observations will confirm the success or failure of actions, as well as provide new information about the environment due to its actions or other actors in the environment. Going back to our discussion of ANS for ships: In the sensing phase, the ANS uses SitAw sensors such as radar, lidar, cameras, and the Automatic Identification System (AIS) to detect the environment and nearby vessels. AI algorithms can process data from these sensors to identify and classify objects, track their movements, and predict their behavior. It also gathers data on the ship’s current state from sources like the global navigation satellite system (GNSS), inertial measurement units (IMU), electronic navigation charts for bathymetric information, and engine monitoring systems. The planning phase involves interpreting this information to evaluate traffic situations and regulatory obligations, and to generate optimal maneuvers considering static and dynamic obstacles, environmental conditions, and mission objectives. AI algorithms, such as deep reinforcement learning, are trained using various traffic and environmental scenarios to ensure compliance with maritime regulations and optimize maneuvers. Finally, in the acting phase, the system controls ship actuators—such as propulsion and rudder systems—to carry out the planned actions. AI can control these systems to execute precise maneuvers, adjusting in real-time based on feedback from sensors.
Figure 2 shows the ANS architecture for a maritime autonomous surface vessel, with a SitAw module included alongside the typical guidance, navigation, and control modules. The reasoning and planning components of the ANS typically feature a hierarchical software architecture designed to: (1) evaluate traffic situations and regulatory obligations, (2) plan optimal maneuvers considering obstacles, environmental conditions and forces, mission objectives, etc., and (3) control the actuators, such as propellers and rudder, to execute the plan. Our collaborations on testing ANS have primarily focused on the reasoning and planning components of ANS so far, but understanding the implementation, performance, and limitations of SitAw systems is equally important.
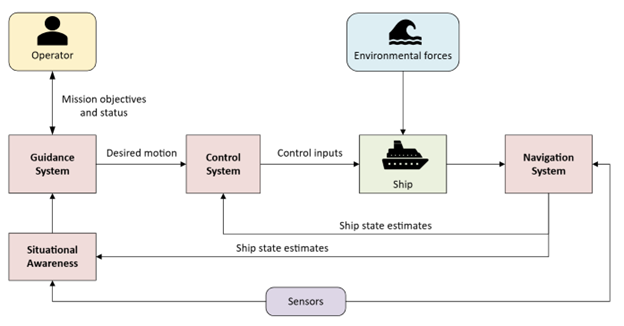
Figure 2: The ANS architecture for a maritime autonomous surface ship. This figure is an extension of Figure 11.1 in T.I. Fossen’s Handbook of Marine Craft Hydrodynamics and Motion Control, 2nd ed., 2021.
BRAIN NTNU is a student-driven organization focused on planning, organizing and creating AI arrangements for NTNU students, in collaboration with national research and industry partners. When BRAIN reached out to DNV about organizing a hackathon for NTNU students, this seemed like a great opportunity to delve deeper into SitAw systems. Our goal was to enhance our understanding and to test methodologies for SitAw systems, which are crucial for the safe and efficient operation of autonomous ships. For the participating students, the hackathon provided a valuable opportunity to gain hands-on experience, develop practical AI skills, and network with industry professionals.
Task given to the participants
For this hackathon, we tasked the participating students with developing an object-detection machine learning model specifically designed for autonomous ships. Their primary goal was to create a model capable of accurately detecting and labeling moving objects in camera data from the Hurtigruten vessel. While achieving high accuracy in classification tasks was a key objective, we also encouraged participants to consider other critical aspects, such as model speed, explainability, and the ability to report uncertainty.
To facilitate the hackathon submission process, we utilized the Kaggle platform. Kaggle is a well-known online community and competition platform for data scientists and machine learning practitioners. It provides a collaborative environment where participants can access datasets, share code, and compete in various challenges to solve real-world problems.
At the end of the hackathon, we asked participants to submit their implementations on the Kaggle competition page. Additionally, they were required to prepare a two-page report with a description of their model, detailing their approach, methodologies, challenges they encountered, and ideas for future improvements. To complement their written submission, participants also delivered a five-minute presentation, showcasing their model's performance and insights gained during the development process.
Description of the dataset
For this task, we utilized a dataset from DNV, with labeled camera data from the Hurtigruten vessel. This dataset had been labeled with bounding boxes and object classes. The images capture the bow of the Hurtigruten vessel and anything visible in front of the vessel during its voyage, under various lighting conditions. Figure 3 shows some examples of the images in the dataset.
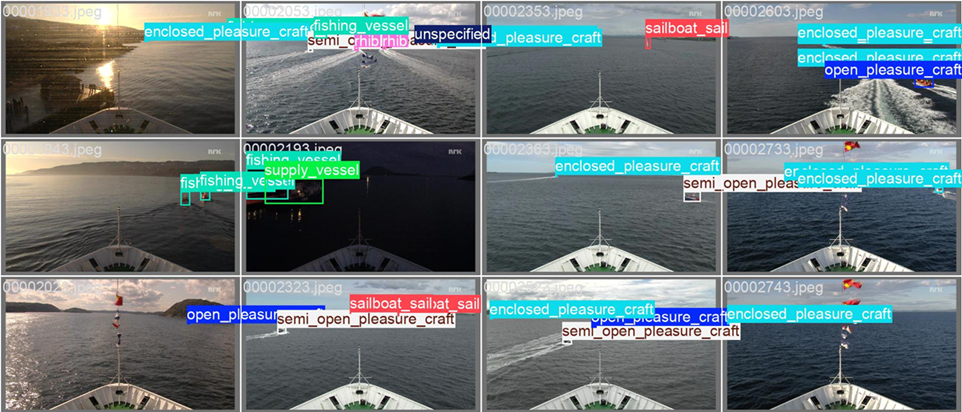
Figure 3: Example images from the DNV Hurtigruten labeled dataset, with bounding boxes and labels for objects in front of the vessel.
The dataset prepared for the competition comprised 464 images, each accompanied by annotation text files (labels). We divided the dataset into three sets: training (70%), validation (20%), and testing (10%). The labels for the test set were withheld during the competition, to ensure unbiased scoring of submissions. The images were provided in both JPEG and PNG formats, with a resolution of 1920x1088 pixels. The labels and annotations followed the YOLO format, where bounding boxes are specified as x, y, width, and height, all normalized. YOLO (You Only Look Once) is a popular real-time object detection algorithm, known for its speed and accuracy in identifying objects within images.
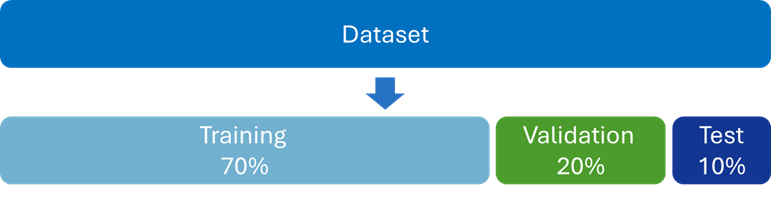
Figure 4: Dataset division for the hackathon.
The object classes in this dataset were as follows:
-
0: open_pleasure_craft,
-
1: enclosed_pleasure_craft,
-
2: semi_open_pleasure_craft,
-
3: fishing_vessel,
-
4: unspecified,
-
5: rhib,
-
6: sailboat_sail,
-
7: sailboat_motor,
-
8: supply_vessel,
-
9: rescue_vessel
Each object in the images was described by a bounding box (pixel coordinates) and one of the above class labels. Notably, the sailboat class is split into two separate classes —sailboat_sail and sailboat_motor— to align with autonomous collision avoidance requirements. According to the collision regulations, different behaviors are required depending on whether a sailboat is using its sail or is powered by a motor.
Evaluating submissions
The evaluation criteria for the final ranking in the hackathon were a combination of model performance (50%), the quality of the report content (25%), and the quality and effectiveness of the presentation (25%). To assist participants, we provided a table of contents for their two-page final reports and five-minute presentations. To streamline the evaluation process while the hackathon was ongoing, we used the Kaggle platform. One limitation is that it allows for only a single evaluation metric. Kaggle competitions feature both public and private scoreboards. The public scoreboard displays the participants' scores based on a subset (30%) of the test data, available during the competition, while the private scoreboard, which is revealed after the competition ends, ranks participants based on their performance on the remainder (70%) of the test dataset.
For this hackathon, we used the mean Average Precision at 50% Intersection over Union (mAP50) as the primary evaluation metric on the Kaggle platform. mAP50 measures the accuracy of object detection models by calculating the average precision across all classes at a specific Intersection over Union (IoU) threshold of 0.50. IoU measures the overlap between the predicted bounding box and the ground truth (labeled) bounding box, calculated as the area of overlap divided by the area of their union. IoU values range from 0 to 1, where 0 indicates no overlap and 1 indicates perfect overlap.
In addition to the mAP50 score, we calculated other evaluation metrics, independent of Kaggle, based on the student team’s final submissions for the whole test dataset, to provide a comprehensive assessment of each submission. Note that we allowed all student teams to submit 2 final submissions, and we calculated the full score for each of these two submissions, using the best score for the final ranking. The extra performance metrics were:
-
Precision: The proportion of true positive detections among all positive predictions, indicating the model's ability to avoid false positives.
-
Recall: The proportion of true positive detections among all actual positives, measuring the model's ability to detect all instances of a class. Recall is particularly important for avoiding collisions with obstacles.
-
F1-Score: The harmonic mean of precision and recall, providing a balanced measure of the model's performance.
-
mAP@50-95: The mean Average Precision averaged over multiple IoU thresholds from 0.50 to 0.95 in steps of 0.05, providing a more comprehensive and stricter evaluation of the model's performance across different levels of overlap.
We emphasized to the students, in advance of the competition, the importance of recall over precision for this particular challenge: they needed to ensure the model could detect all potential obstacles to avoid any collisions, even if they got the exact class wrong. However, we also highlighted that precision becomes crucial once high recall is achieved, to accurately adhere to collision regulations (COLREG). As aforementioned, COLREG has different rules for encountering a motor-powered sailboat versus a sailing sailboat-
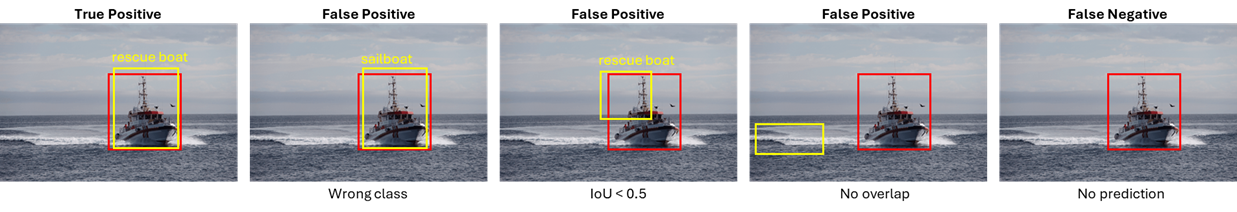
Figure 5: Demonstration of true positives, false positives, and false negatives in object detection and classification.
At the end of the hackathon, we evaluated the model performance metrics, the student team’s reports, and presentations, to create a ranked list for the total scoring of all submissions.
In addition to evaluating model performance, we also assessed the submissions based on sustainability and creativity. For sustainability, we looked for solutions that achieved the greatest impact with minimal computational resources, both during training and inference, to consider DNV’s goals for sustainability. Furthermore, we added the creativity price in order to value innovative thinking, e.g. by including unique features, the best methods for predicting credibility and uncertainty, enhanced explainability, and employing smart training techniques.
Hackathon organization
The BRAIN NTNU team took charge of organizing the practical aspects of the hackathon. They promoted the event through their social media platforms and within NTNU, ensuring a wide reach, and a sold-out event. The hackathon was held at NTNU Helgasetr, complete with catering and snacks for the participants. Additionally, BRAIN reserved a local restaurant for the final presentations and the announcement of winners, creating a celebratory atmosphere for the conclusion of the event.
From the technical side, we aimed to streamline the process and provide a robust framework for the participants:
-
We used the Kaggle platform to host the competition, offering an easy-to-use, free, and efficient environment for submissions.
-
A base object detection and classification model was trained at DNV, using the YOLO library, and its source code was provided to the participants as a starting point.
-
To facilitate the submission process, we provided a code snippet to convert YOLO model predictions into Kaggle competition-aligned submission files (CSV). This ensured standardization and saved participants time on developing their own conversion functions.
The hackathon lasted for 24 hours, starting at 17:00 on March 14, 2025. It kicked off with an introductory presentation by BRAIN NTNU. This was followed by a detailed presentation from DNV, covering the hackathon task, theoretical background, evaluation criteria, deliverables, competition rules, and tips for improving the baseline model performance. The BRAIN NTNU team was present at the event venue for the entire 24 hours, providing continuous support. The DNV support team was available intermittently throughout the event, with a strong presence during the first three hours to address any technical issues and assist participants.
Winners and implementations
A total of 9 teams, comprising 34 students, participated in the hackathon. Each team had between 2 to 6 members. All participants are students at NTNU, including exchange students, pursuing diverse programs in computer science, cybernetics and robotics, informatics, data engineering, automation and intelligent systems, electrical and electronics engineering, mechanical engineering, nanotechnology, and industrial economics. This diverse academic background contributed to a rich exchange of ideas and innovative solutions during the event.
At the start of the competition, it was highlighted that there would be three prizes that would be handed out after the hackathon: the main prize would go to the team performing best overall across model performance, report and presentation. Furthermore, there would be two additional prizes: one for creativity and another for sustainability. In addition, at the end of the competition, NTNU BRAIN introduced another 2 prizes; for the best presentation and for the funniest presentation.
In terms of overall performance, the top 3 for the DNV-BRAIN Hackathon 2025 were:
-
Epoch No 20 Freeze 6 (prize winner),
-
Data Driven Dreamers,
-
Crash Course,
As for the other prizes:
-
The creativity prize was won by Data Driven Dreamers,
-
The sustainability prize was won by Gruppe 3,
-
The best presentation prize also went to Data Driven Dreamers,
-
The funniest presentation prize went to Crash Course.
Now, let's dive into the winning teams and explore the innovative methods they employed to achieve their remarkable results, and the reasons for obtaining these prizes.
First prize winner: “Epoch No 20 Freeze 6”
About the team: The winning team consisted of: Isak Orlando W. and Mari Balke F., both final year Master Students at the NTNU Department of Engineering Cybernetics. They have taken several ML courses and gained experience in object detection through their specialization theses.
Model design: After conducting an exploratory data analysis, the team identified significant imbalances in the training dataset. This discovery highlighted the challenges of training an object detection and classification model, particularly for very small objects, which are often underrepresented and difficult to detect accurately.
To tackle the challenge of detecting and classifying small objects, the team integrated the Slicing Aided Hyper Inference (SAHI) framework into their prediction pipeline. SAHI was chosen for its proven ability to enhance the performance of the YOLO model, particularly with small objects (See Figure 6). The team began by augmenting the training data to align with SAHI's inference process, which involved creating image patches of a specified size with overlapping regions. This approach significantly increased the dataset size, but also introduced many images without any objects of interest. To optimize the training process, the team resampled the dataset by removing 50% of the images that contained no vessels, a parameter selected ad hoc and identified for potential future optimization.
Figure 6: Detecting small objects with SAHI and YOLO model (Image source: https://github.com/obss/sahi).
Despite the resampling strategy, the team faced another challenge: the imbalance in class populations. To address this, they developed a custom dataset class by extending the standard YOLO Dataset class. This custom class implemented a weighted probability system, which increased the likelihood of sampling from minority classes. This smart sampling strategy ensured a more balanced representation of classes in the training data, ultimately improving the model's ability to recognize and classify objects accurately. The differences in sampling distribution and the impact of the sliced data were evident in the improved performance of the object detection model. The difference between default and weighted probability distributions is presented in Figure 7.
Introducing SAHI requires additional compute power due to the division of input images into multiple windows, demanding more resources for real-time detection. Determining the appropriate window size for splitting the training data was crucial. Too-small windows led to more false positives due to insufficient context. Through testing, the team balanced the trade-off between small and large window sizes, achieving a good object detection accuracy.
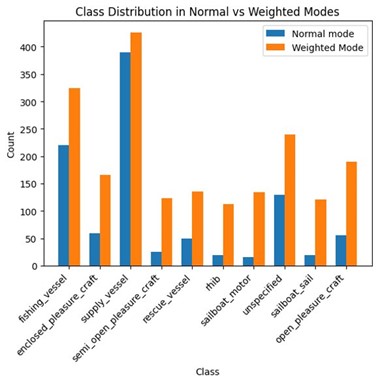
Figure 7: The difference between default and weighted probability distributions of object classes.
Resource requirements: The team used the GPU T4x2 from Kaggle to train their model and generate submission predictions. Resampling the training and validation data to smaller window sizes increased the overall size of the training data, leading to higher resource consumption. The entire training process took about 2 hours.
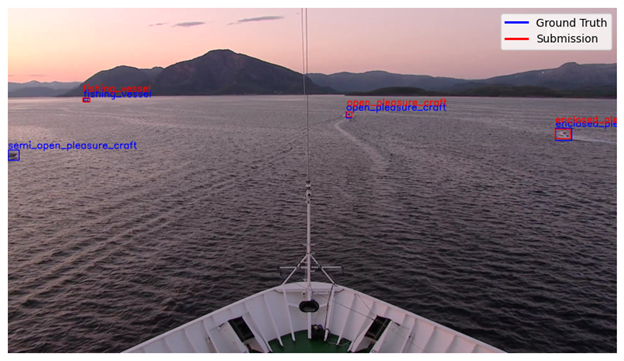
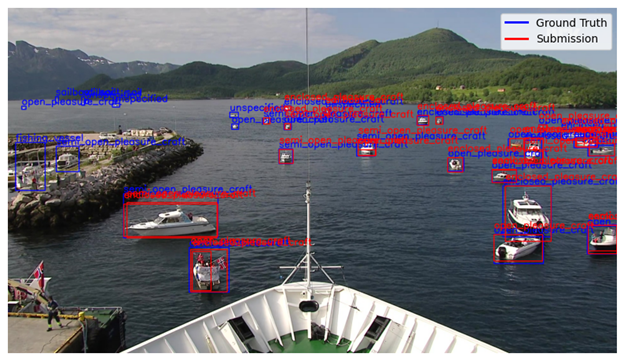
Figure 8: Example results from the Epoch No 20 Freeze 6 team, showing ground truth and predicted labels.
Performance: The Epoch No 20 Freeze 6 team ended up third in the public ranking on Kaggle and 4th in the private ranking. However, combining the Kaggle scores with the additional metrics (mAP@50-95, precision, recall, and F1-score), as well as the performance on the report and the presentation, this team ended up first in the total competition ranking, showcasing also the importance of providing concise and detailed reporting on their approach.
Creativity prize winner: “Data Driven Dreamers”
About the team: The second prize-winning team consisted of: Folke J., Parleen B., Ludvig Ø., and Thomas Nordby S. Folke, Ludvig, and Thomas are computer science undergraduates, while Parleen is an electrical engineering undergraduate at NTNU. They are all members of Cogito, NTNU's technical student organization for AI.
Model design: The team implemented their model using YOLO version 11, with automated hyperparameter tuning via the Optuna package. They optimized parameters such as learning rate, regularization strength, and loss weights for bounding box regression, class prediction, distribution focal loss, and pose estimation.
Data augmentation techniques, including horizontal flipping, brightness and contrast adjustments, and geometric transformations (shifting, scaling, rotating), were applied using the Albumentations image augmentation tool. The team reported that the data augmentation step enhanced the model's generalization, robustness, and performance, particularly in the classification accuracy and recall.
Training involved experimenting with various YOLO model sizes, batch sizes (2 to 16), and image sizes (640 to 1820). Epoch counts initially ranged from 10 to 300, but optimal epochs were determined using an early stopping strategy based on validation loss stability, conserving computational resources and training time.
To monitor the training performance, they analyzed metrics such as bounding box loss, classification loss, distribution focal loss, precision, recall, and mean average precision (mAP@50 and mAP@50-95). These metrics guided the iterative adjustments made to the model and the training parameters, visually tracked through detailed loss and performance graphs.
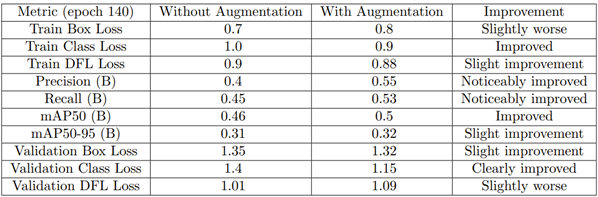
Figure 9: Monitoring results of with and without image augmentation.
Resource requirements: This team experimented with three GPU setups: Folke’s PC (RTX 3090, 24 GB VRAM), NTNU’s Cybele lab PC (RTX 4090, 24 GB), and Kaggle’s Tesla P100 GPU. To fit models within the available VRAM, they adjusted parameters like YOLO model size, batch size (up to 16), and image resolution (ranging from 1088 to 1920). Interestingly, they found that a small YOLO model trained on Kaggle with modest settings (batch size 8, image size 1088, 5 epochs) completed in just 5 minutes on the RTX 3090—and still achieved one of the highest public Kaggle scores. In contrast, longer training runs (3–4 hours) did not lead to better results, at least according to the Kaggle public ranking. Their findings suggest that efficient model tuning mattered more than raw compute time.
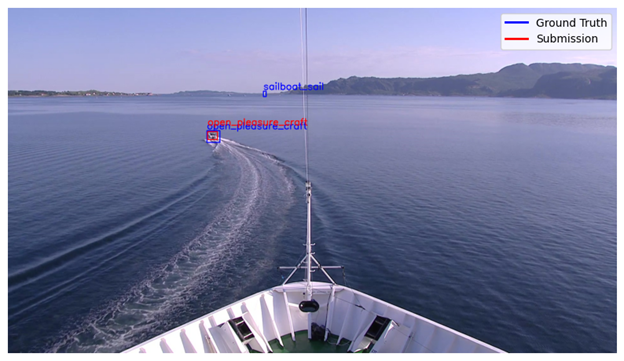
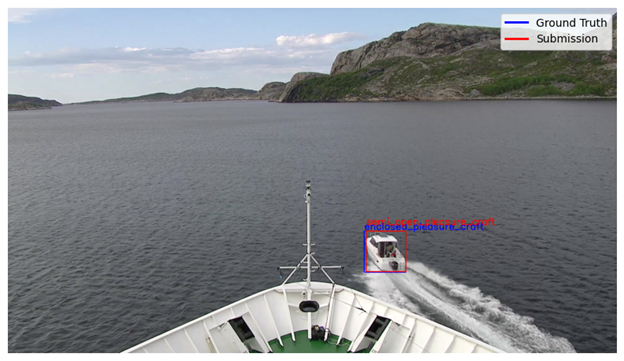
Figure 10: Example results from the Data Driven Dreamers team, showing ground truth and predicted labels.
Performance: The Data Driven Dreamers team ended up second in the Kaggle public rankings and first in the Kaggle private rankings. However, combining with the extra metrics, as well as the report and presentation score, they ended up with 0.003 points less than the top-performing team, in second place for the overall competition.
DNV decided to give this team the Creativity prize, given their thorough approach towards development and improvement of the ML model, and smart use of open-source packages.
Sustainability prize winner: “Gruppe 3”
About the team: The third prize-winning team consists of three members: Arild G. from NTNU Informatics, Nayanthara S., a data science enthusiast with a background in electrical and electronics engineering from NTNU, and Haig Conti G. S. from TU Munich, specializing in robotics.
Model design: Gruppe 3's main method that enabled them to win the sustainability award was their focus on optimizing model performance while minimizing computational power. They experimented with different model sizes and parameters, ultimately finding that a larger image size and fewer epochs (150) provided the best balance between precision and recall, with a shorter inference time. Their approach included: - Hyperparameter Tuning: Adjusting image size, learning rates, and epochs to find the optimal configuration. - Optimizer Selection: Instead of using YOLO’s default optimizer (Stochastic Gradient Descent), they explored using different optimizers like Adam to enhance model efficiency.
Table 1: Model experimentation results executed by Gruppe 3.
| No | Model Design | GPU | Inference Time (ms) | Precision | Recall | mAP50 | mAP50-95 |
|---|---|---|---|---|---|---|---|
| 1 | YOLO v8, epoch=100, optimizer=SGD | GPU-T4×2 | 9.6 | 0.414 | 0.471 | 0.433 | 0.261 |
| 2 | YOLO v8, epoch=300, optimizer=SGD | GPU-T4×2 | 9.6 | 0.474 | 0.404 | 0.435 | 0.298 |
| 3 | YOLO v11, epoch=300, optimizer=SGD | P100 | 9 | 0.480 | 0.455 | 0.449 | 0.299 |
| 4 | YOLO v11s, epoch=150, optimizer=Adam, image size=1024 (increased) | P100 | 8.6 | 0.504 | 0.562 | 0.539 | 0.357 |
They reflected that increasing the image size was particularly beneficial for detecting distant boats, enhancing the model's ability to identify objects at greater distances. Additionally, they recommended using smaller models and fewer epochs during the initial testing phase to quickly evaluate different parameters. Once optimal settings were identified, they suggested employing a larger model with more epochs for the final training to achieve the best results.
Resource requirements: In their final submission model, they used one NVIDIA Tesla P100 GPU, provided training data, and YOLO v11s model.
Performance: The Gruppe 3 team ended up in 6th place in the Kaggle public ranking, and 3rd place in the Kaggle private ranking. After combining the Kaggle private score with the extra metrics, as well as the report and the presentation, this team ended up in 8th place, losing some valuable points on their report, compared to other teams. Though this team did not achieve the performance, DNV decided to give this team the Sustainability prize, because of their relatively good performance (model performance ranking 3rd in Kaggle private and 6th on all metrics), given the limited computational power that was used to get that performance.
Special prize for best presentation: “Data Driven Dreamers”
The winners of the Best Presentation special prize were also recognized for their creativity. Their outstanding presentation and exceptional presentation skills set them apart from the other teams, making them truly deserve this award.
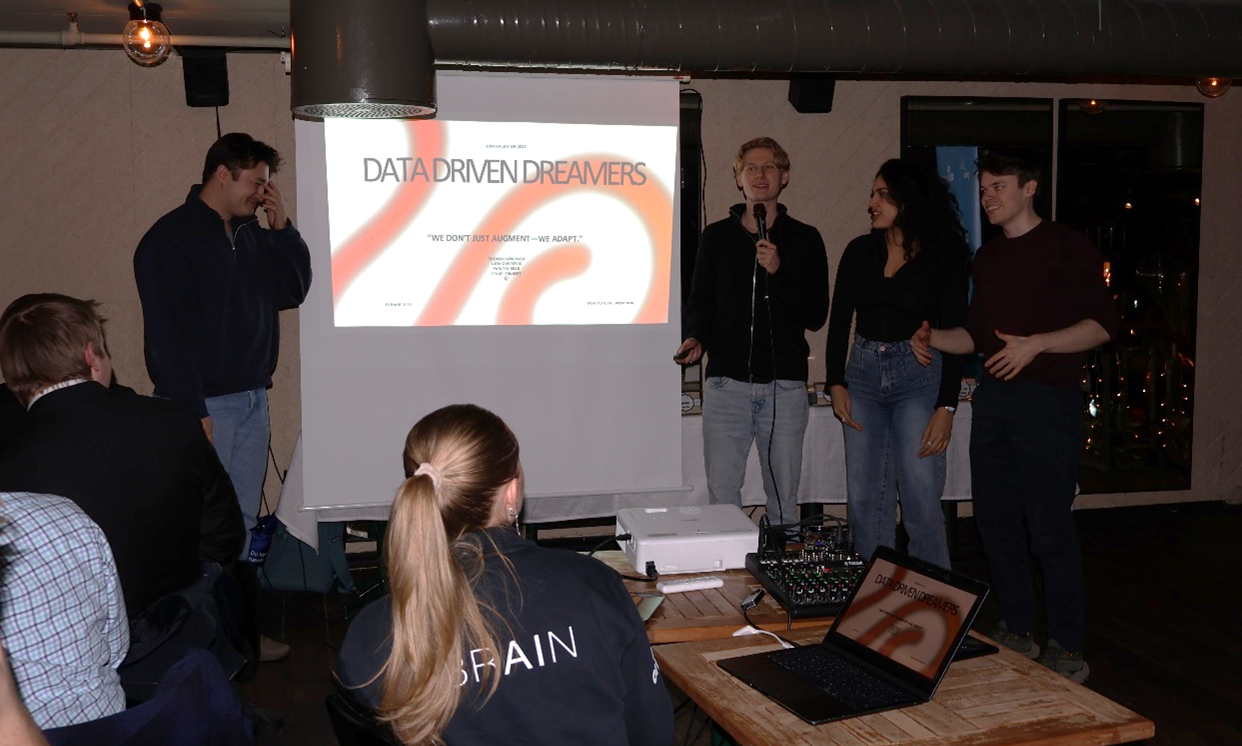
Figure 12: Data Driven Dreamers presenting their submission.
In their presentation, they included sections on:
-
Team Members: Introducing each member and their roles.
-
Overview of Their Submission: Providing a clear summary of their project.
-
Model Design Choices: Explaining the rationale behind their design decisions.
-
Performance Results: Highlighting key metrics and outcomes.
-
Resource Requirements: Detailing the resources used for their project.
-
Discussion on Strengths and Weaknesses: Analyzing the pros and cons of their approach.
-
Hackathon Reflections: Sharing insights and experiences from the event.
Their professional communication and effective teamwork, with each member sharing the floor, contributed significantly to their success.
Special prize for funniest presentation: “Crash Course”
Team Crash Course won the funniest presentation reward for their amusing presentation filled with funny visuals, memes, and smart verbal jokes.
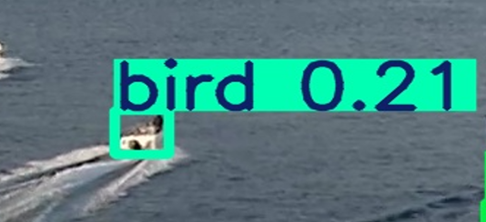
Figure 13: Some of the visuals from Crash Course team’s presentation.
About the team: The team consisted of: Filip R. S., a student in Automation and Intelligent Systems and DevOps Engineer for Orbit NTNU; Konrad K., a data engineering student and leader of Make NTNUs dev team; Theodor S.T., a data engineering student and member of ReLU NTNU; and Martin H.
Model design: The team focused on object detection for maritime vehicles using the YOLO v11 model. They employed several advanced techniques:
-
GRAD-CAM: Used for visual explanations to understand model predictions.
-
Manual Labeling: Ensured high-quality training data.
-
Data Augmentation: Techniques like flipping to enhance model robustness.
-
Training: The model was trained on 1000x1000px image crops over 250 epochs, with performance improvements diminishing after epoch 250.
The team emphasized the importance of explainability in their model design. They used GRAD-CAM to create attention maps for CNNs, analyzing the last two layers to visualize what the CNNs were focusing on. Extensive logging through Ultralytics, including confusion matrices and precision-confidence curves, helped them monitor and improve model performance. For data augmentation, they experimented with various techniques such as flipping, reflections, rotations, adjustments in hue, saturation, brightness, and adding visual elements like rain, black boxes, and noise. Ultimately, they found that simply flipping the images yielded the best results, although the model adapted to noise too easily.
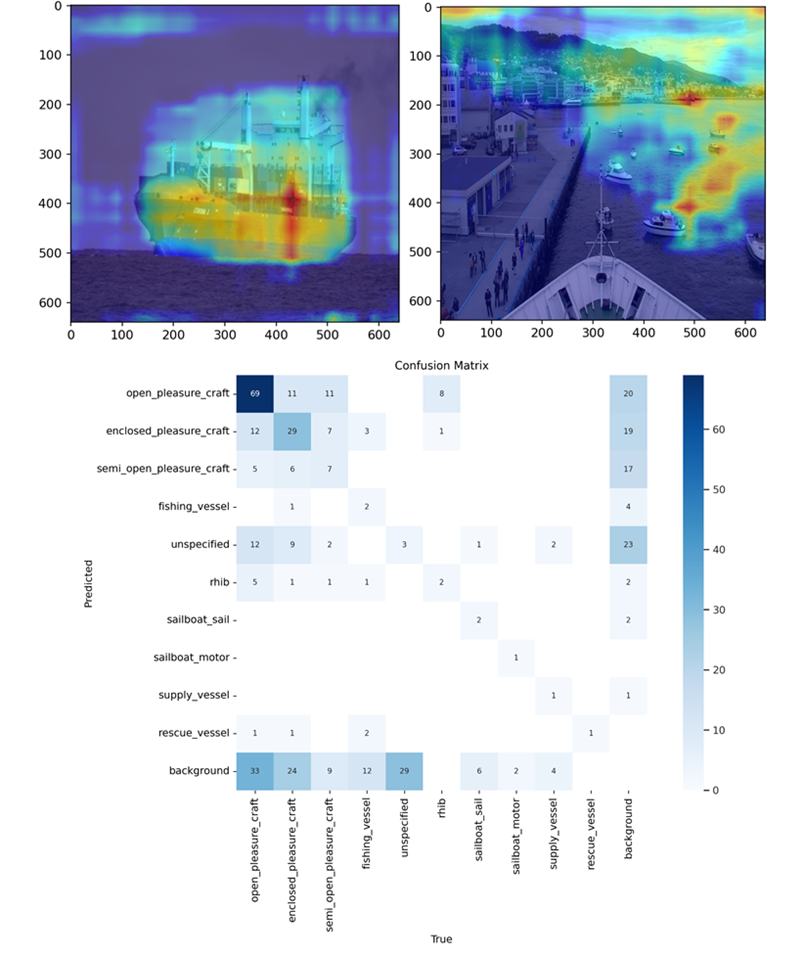
Figure 14: GRAD-CAM attention map for CNNs and confusion matrix for vessel classes.
Resource requirements: For their final submission, they used one NVIDIA RTX 4090 (24GB) and one NVIDIA P100 GPU. The training took approximately 6 hours, utilizing external data sources like NRK Beta.
Performance: Team Crash Course ended up 4th in the Kaggle public ranking and 2nd in the Kaggle private ranking. When combining the private ranking score with the additional metrics, as well as the final report and presentation, this team became 3rd in the overall competition.
Lessons Learned
For the report and presentations, we asked students to evaluate the hackathon experience and lessons learned.
Student teams learned more about:
-
How to create machine learning models,
-
How to balance model complexity, resource limitations and training strategies,
-
Real-world constraints in AI projects,
-
That increasing image size used by YOLO improves detection of small objects,
-
How to optimize model for minimal false negatives,
-
That more data augmentation does not necessarily lead to a better recognition model when having too little data,
-
Effective image preprocessing goes beyond resizing,
-
A small model can sometimes outperform a larger model when having little data,
-
YOLO pretraining does not always increase performance when working with a very specific dataset.
Some additional highlights from their notes on lessons learned:
-
The importance of a good dataset: garbage in, garbage out.
- Note; we, on purpose, gave the students a very small dataset, given the time limits of the competition. This meant that several classes were rather underrepresented. Data augmentation was listed as one potential aspect to look into for improving their model’s performance.
-
Smart preprocessing of data matters a lot!
-
It is crucial to determine the appropriate window size for splitting the training data. Too small window sizes can lead to more false positive detections due to the model lacking sufficient context.
-
Not everything works the way you expect; something may seem smart based on how we perceive the world (e.g. masking some foreground or background objects), but the neural network may be focusing on other things – it may be using background features in addition, and thus performance does not always increase with such strategies. This reinforces the importance of model interpretability, also in model development/improvement.
-
Analyzing the model’s failures helped a lot in understanding what adjustments to make to the model.
-
The importance of time management should not be underestimated!
In addition, at DNV, we kept notes during the hackathon, and had a discussion the week after the hackathon, to identify topics for improvement for future events. We share some of our findings here, in the hope that it helps other people in organizing hackathons. As we had limited time to prepare for this hackathon, some of these points could potentially have come to light with more preparation and testing before the competition, nevertheless, we hope this helps others who are organizing a hackathon under similar time pressure!
Pros and Cons of Kaggle; Kaggle was a tremendously useful asset, providing the student teams with free resources, and ensuring we did not need to support a million different operating systems and setups. It was great that the students could use GPU acceleration for free, without which it would not have been possible to run this hackathon over a 24-hour time frame. Some things we learned though are that (1) the Kaggle competition is created around the concept of having a single metric to rank teams on. We chose to have one of our metrics (mAP@50) used on Kaggle and finally evaluate all submissions on more metrics outside of the platform, since it was the quickest solution when organizing the hackathon. It would however have been more insightful for the students if we had already combined all metrics into a single evaluation metric as a custom evaluation metric on Kaggle. In addition, (2) Kaggle is currently not a great platform for collaborative coding, (3) and it does not allow for removing submissions or adjusting the number of submissions for one specific team – this could be useful in the case there are some technical difficulties with submission for one team, and you have assessed they can be allowed to get another submission. The submission limits in Kaggle are hard though, and the same for each team. Finally, the competition host site did not allow us to see which students had signed up and been assigned to teams, and we could not see the teams that had signed up until they had made a submission. This made it more of a hassle for us: we had to go around, ensure everyone was signed up and assigned to teams, and that there were no issues with that – it would have been easier if that info would have been visible to competition hosts, given that we had the list of teams and team members. Nevertheless, as said, Kaggle is a great platform. The above are just some current limitations to consider in your organization and planning. We also added comments and new feature requests to the Kaggle website for these points, some of which Kaggle replied are on their roadmap.
Organization/planning; We had only about an hour to evaluate all submissions between the hackathon, presentations, and the prize ceremony – which proved insufficient. Some time was spent collecting and organizing submissions from multiple sources, highlighting the need for clearer advance instructions on file formats, naming conventions, and submission channels. Despite reports being only two pages, reviewing them thoroughly against the grading rubrics took around two hours. With more time, we would have liked to explore the code submissions in greater depth to better understand the technical approaches taken by each team.
Although we had prepared detailed instructions, a few aspects could have been clearer – such as the expected language for reports and presentations, and guidance on experiment tracking. These would have helped level the playing field, especially considering the wide range of academic backgrounds. We were, however, glad that we had provided a base model and starter code, which helped even those with limited prior experience get started.
Conclusion
The submissions to the DNV-BRAIN Hackathon 2025 showcased various innovative methods that helped the student teams create well-performing models, despite a very limited dataset and very little training time and resources. Techniques such as data augmentation, Slicing Aided Hyper Inference (SAHI), custom sampling strategies, and hyperparameter optimization helped improve performance, and GradCAM attention maps for CNNs were pivotal for explainability. Additionally, aiming for sustainability through smart model decisions was a key focus for DNV. These methods serve as valuable tips and guidance for researchers looking to implement object detection and classification in their own work.
DNV is committed to advancing assurance strategies for maritime vessels with autonomous capabilities. Testing the emergent behaviors of autonomous systems is crucial for ensuring their reliability. Given that autonomous systems are comprised of multiple subsystems, it is essential to build trust in each of these components. SitAw, a key subsystem within an ANS, is an important subsystem for DNV, as we aim to understand its capabilities and limitations thoroughly, towards ensuring that autonomy providers develop and deliver safe and trustworthy systems. This hackathon provided a valuable opportunity for both students and DNV to develop high-performance object detection and classification models tailored for maritime applications. The baseline models, created by the student teams, can serve as a foundation for future research on simulation-based testing procedures for SitAw systems. Additionally, the Hackathon fostered collaboration between DNV, BRAIN and university students, allowing them to gain hands-on experience in solving industry challenges, interact with DNV professionals, and enhance their presentation skills by showcasing their solutions to a broader audience.
We at DNV thoroughly enjoyed the creation and execution of this hackathon and hoped the student teams had as much fun, and found this to be an enriching event, providing valuable learning experience. In addition, we hope that some of these students will consider student and trainee positions at DNV, for example at DNV Norway, having gotten more insights into all the different areas of research and development at DNV!
Hackathon organizers (in alphabetical order):
Melih Akdağ, Stephanie Kemna, Magnus Kristiansen, Edward Yi Liu, Jorge Luis Mendez, Hee Jong Park, Chanjei Vasanthan
Hackathon judges (in alphabetical order):
Melih Akdağ, Stephanie Kemna, Magnus Kristiansen, Jorge Luis Mendez, Hee Jong Park, Cesar Ramos de Carvalho, Chanjei Vasanthan